Introduction
You are a Data Scientist working for an Australian retail chain operating in the “Clothing Retailing” industry.
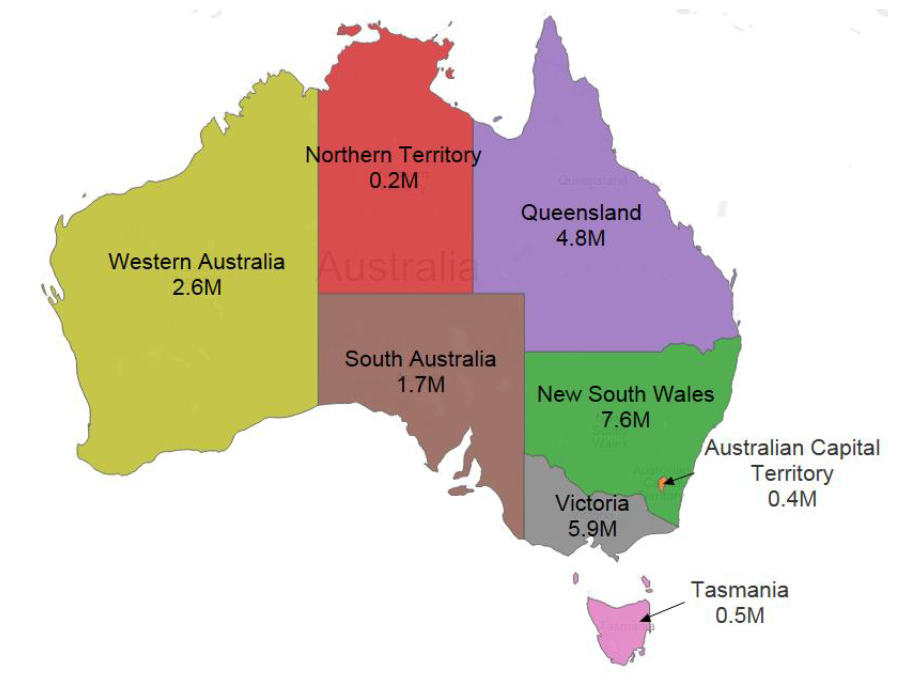
To date the company has only been running operations in New South Wales. However, the Board of Directors is considering an expansion into one of the following three states:
- Queensland
- Victoria
- Western Australia
You have been asked to assess the business environments for the industry in question in each of these three states and present your findings to the Board of Directors in person.
Visualization
Demo:
Check the full-version:
Notes
-Box plot:
- maximum, Q3(upper quartile), Median, Q1, Min
- Interquartile Range: make sure our analysis is not affected by outliers.
- how to determine if an observations is too far away? 1.5 * IQR, if an observation falls further than that,shouldn’t include it in the box plot, it consider an outlier
- use case: check the shape of distribution, compact or narrow, uncertainty
how to deal with big data
use data source filters in the top right of the bottom.
In this section:
we learned:
- First build charts,then build dashboard, then build presentation
- advanced time series blending
- do forecasting
- how to present story line